The Royal Society promotes excellence in the teaching of science, mathematics and computing while also encouraging and supporting investigative work in the classroom. On this page you will find details about the different schemes and opportunities you can get involved with and you can explore our free resources.
For further information or if you have any specific questions, please contact the Schools Engagement team at education@royalsociety.org. To receive updates about all our programmes, resources and funding opportunities, please sign up to our UK teachers newsletter.
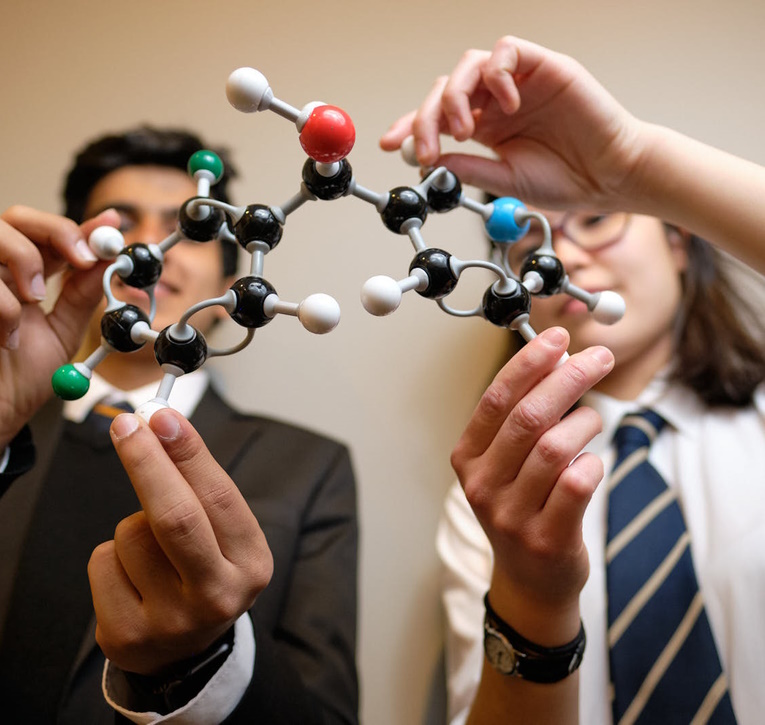
Explore our resources

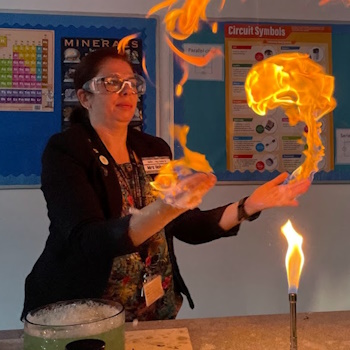
Brian Cox school experiments
The Royal Society presents video resources featuring Professor Brian Cox presenting experiments…
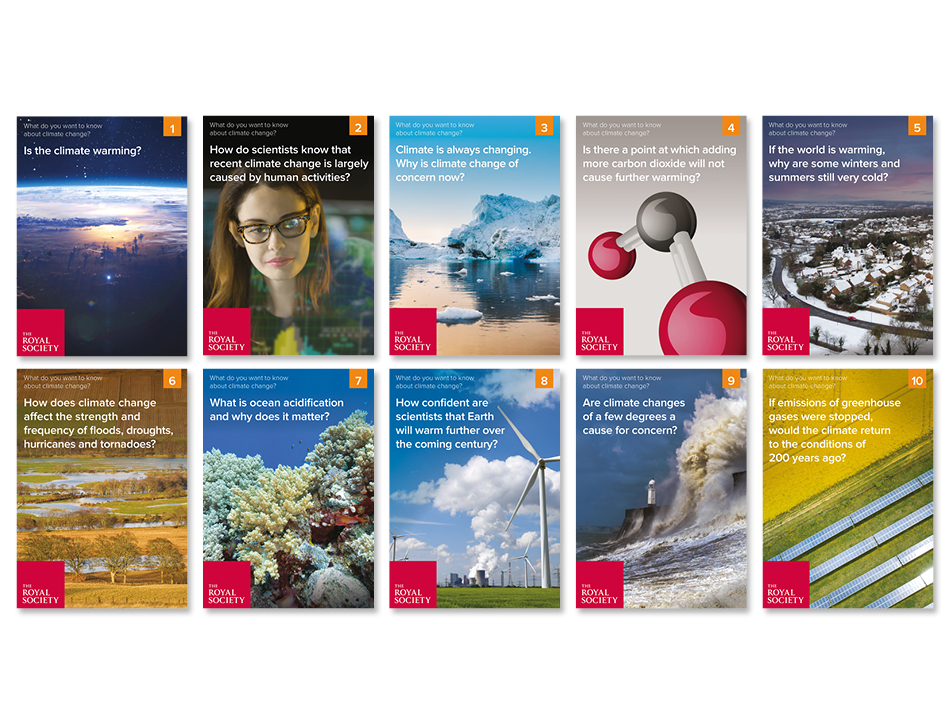
What do you want to know about climate change?
This resource is based on the latest evidence available to scientists and has been adapted from…
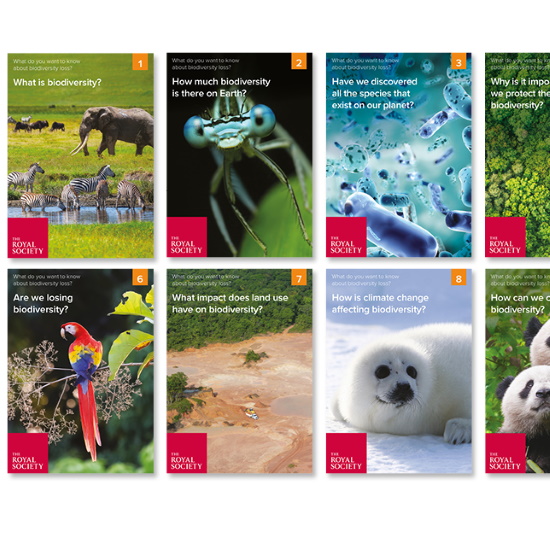
What do you want to know about biodiversity loss?
This resource is based on the latest evidence available to scientists.
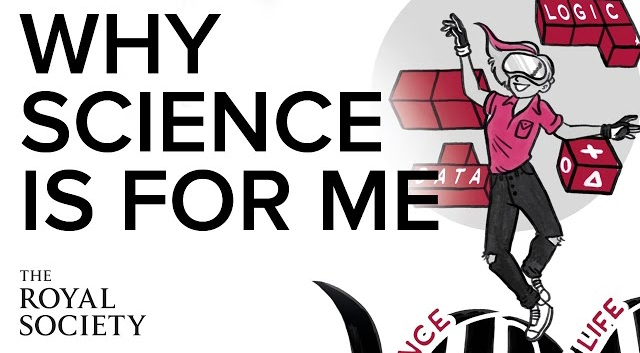
Why science animations
Animations aimed at school aged students to highlight the benefits of scientific study and the…

Global challenges
Curriculum linked resources to support the teaching of climate science and sustainability.

Animate materials resources
Resources to support the teaching of materials at primary and secondary level

Machine learning resources
The Royal Society contracted the British Science Association to produce a series of CREST…
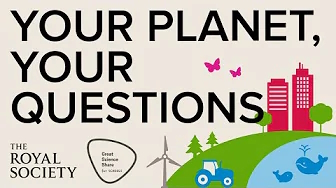
Your Planet, Your Questions video clips
Aimed at students aged 5 to 14 the Your Planet, Your Questions event took place in June 2021,…
Young People's Book Prize school resources
Free resources to use in the primary school classroom
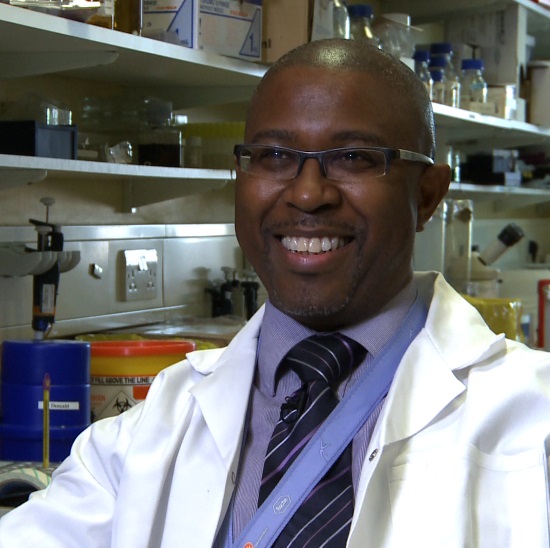
Inspiring scientists
Explore diversity in science
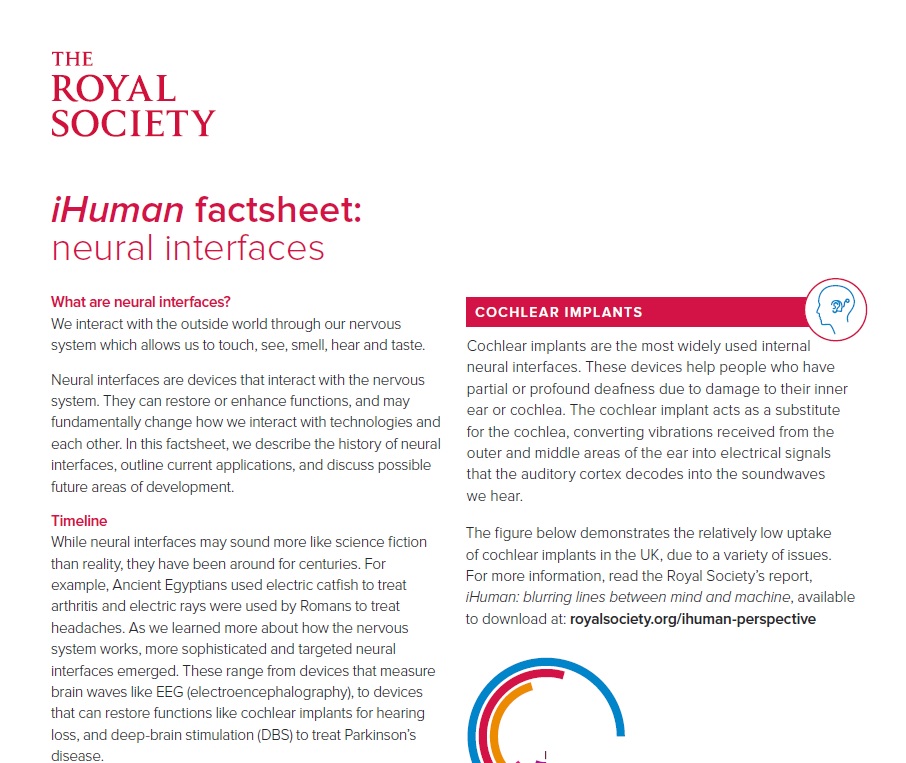
Factsheets - future science
Explore factsheets on some of the latest work by the Royal Society. Content may be used to enhance…

Shared resources from our Schools Network
Sharing curriculum linked resources, identified by teachers in the Royal Society Schools Network,…
Recent blog posts
View all posts
Miss Sam Holyman BSc(Hons) MRSC CSciTeach PGCE
In News and views
5 min read
Partnership grants: impact on physics teaching
Sam Holyman , a Chemistry teacher from Aylesford School in Warwick, shares her experience so far…


Peter Finegold
In News and views
4 min read
Why the next government should commit to a fundamental review of the education system
In this first blog of a new series, Peter Finegold sets out the Royal Society’s key ask of…

Emils Gedrovics
In News and views
5 min read
New streamlined application process with plenty of support to secure up to £3,000 of funding for your investigative Partnership Grants project
The Partnership Grants scheme is designed to help all schools access funding to carry out an…