Keith Moore brightens up January with some colourful spot paintings by Richard Waller FRS and William Benson.

How did January begin for you? A bit liverish? Spots before the eyes, perhaps? I know the feeling well, but I’ve found some brand-new (well, old) spots to cheer me by reminding me of some very contemporary art.

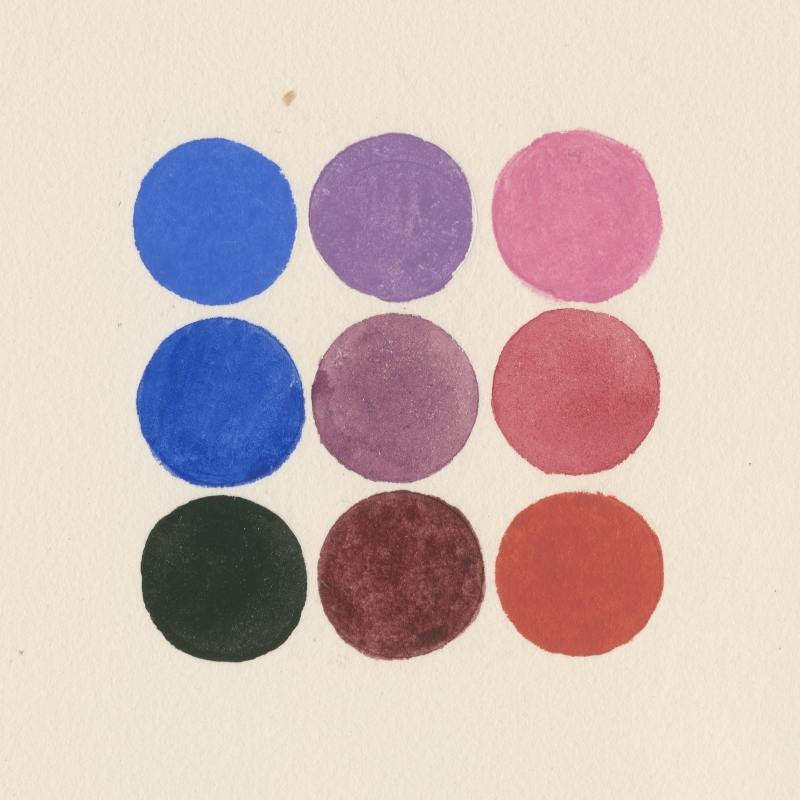
Colour spot chart by William Benson, from Principles of the science of colour, 1868, facing p.27
Colour spot paintings are not uncommon in the co-joined histories of art and science. Once you look, you begin to see them everywhere, from the low art Ben-Day dots in the vintage comic books I used to read as a child to the high art pointillism and divisionism pioneered by Georges Seurat (1859-1901) and his followers. What these techniques exploit is the illusion of seeing a range of colour shades and apparent brightness produced through the proximity of a more limited palette of paint or ink stippling.
Many artists have used colour theories developed by scientists including Newtonian ideas to inspire and explain their work, admittedly with a sometimes shaky grasp of the original science. Scientists in their turn have used colour dots for practical ends that can be aesthetically pleasing too. At school, I recall being subjected to the fascinating colour-blindness tests of Dr Shinobu Ishihara (1879-1973) where numbers are hidden within circular dual colour fields. These charts employ what is known as pseudoisochromaticism: when distinct tones are perceived as equivalent, there may be a limitation in the test subject’s colour perception, often caused by inherited genetic mutation.
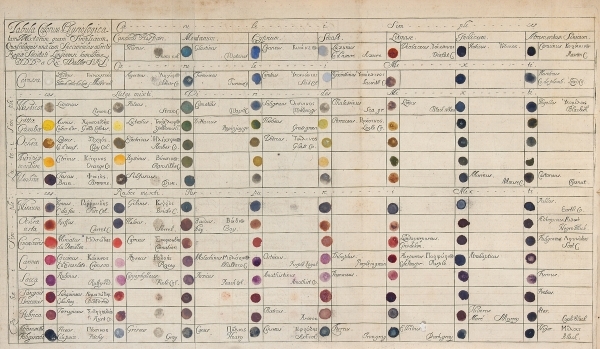
The first colour illustration to be found in the Royal Society’s Philosophical Transactions is a hand-finished pigment spot chart based upon the work of Richard Waller FRS (c.1660-1715) whose 1686 paper 'A catalogue of simple and mixt colours with a proper specimen of each…' contained the prototype pantones. Waller’s intention was the opposite of deception as he hoped to make a plain standard of colour nomenclature for descriptive use in natural philosophy. His original, presented to the Royal Society, no longer exists: sadly (shortsightedly?) it was painted on glass…

Colour chart by Richard Waller, from his ‘Catalogue of simple and mixt colours’, Phil. Trans. vol. 16 pp. 24-32
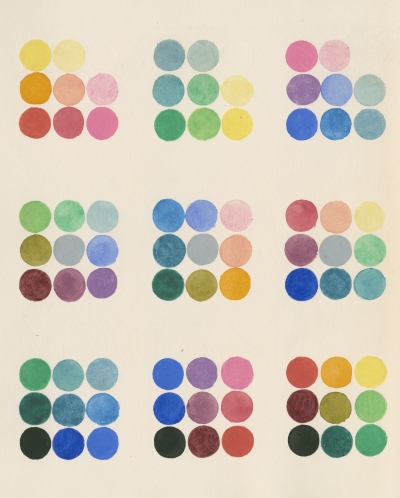
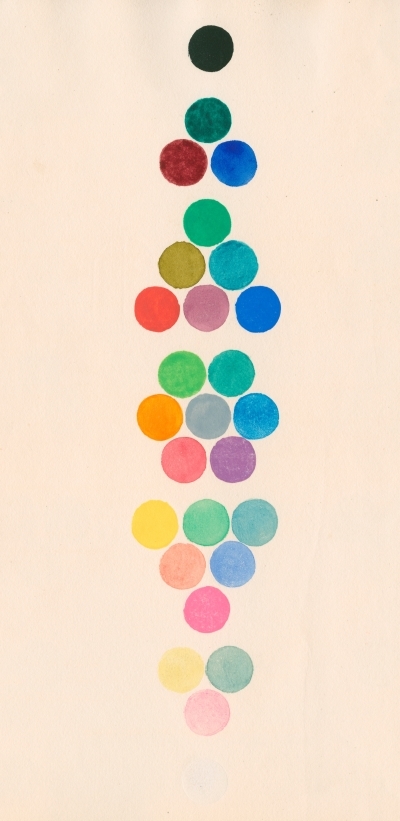
It is in this tradition of identification and relationships between colours that the nineteenth century book Principles of the science of colour was written by William Benson, an architect living in Albany Street, London. Benson corresponded with Royal Society secretaries George Gabriel Stokes (1819-1903), to whom he dedicated his book, and John Herschel (1792-1871) both of whom who had previously researched light and colour (and indeed colour-blindness). Benson created what he termed a ‘cube of colour’ to elucidate hues. He illustrated the result by making spot paintings on plain white backgrounds to show the ordering of colour on the axes of his cube – really a variation on the more familiar colour wheel.

Colour spot chart by William Benson, from Principles of the science of colour, 1868, facing p.31
I think you’ll agree that although these pictures weren’t conceived as art, they are reminiscent of Damien Hirst’s spot paintings. The entire 1986-2011 output of the Hirst workshop has been catalogued very recently and exhibited by the Gagosian Gallery; and the catalogue includes one painting, Beagle 2, which hangs at the Royal Society. The enjoyable confluence of image traditions isn’t at all surprising, since Hirst has a well-known appreciation and interest in scientific matters, to the extent of naming his own company ‘Science Ltd’. Part of the genius of art is the same as the best scientific skill – being the one to observe and recognize the interest and quality of what can be spotted by anyone.

