14. How fast is sea level rising?
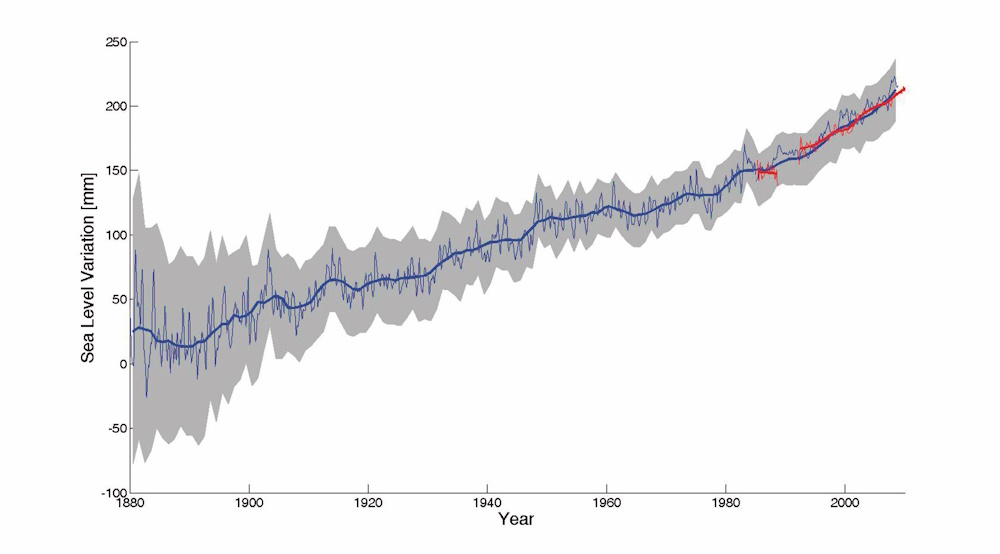
Long-term measurements of tide gauges and recent satellite data show that global sea level is rising, with the best estimate of the rate of global-average rise over the last decade being 3.6 mm per year (0.14 inches per year). The rate of sea level rise has increased since measurements using altimetry from space were started in 1992; the dominant factor in global-average sea level rise since 1970 is human-caused warming. The overall observed rise since 1902 is about 16 cm (6 inches) [Figure 6].
This sea level rise has been driven by expansion of water volume as the ocean warms, melting of mountain glaciers in all regions of the world, and mass losses from the Greenland and Antarctic ice sheets. All of these result from a warming climate. Fluctuations in sea level also occur due to changes in the amounts of water stored on land. The amount of sea level change experienced at any given location also depends on a variety of other factors, including whether regional geological processes and rebound of the land weighted down by previous ice sheets are causing the land itself to rise or sink, and whether changes in winds and currents are piling ocean water against some coasts or moving water away.
The effects of rising sea level are felt most acutely in the increased frequency and intensity of occasional storm surges. If CO2 and other greenhouse gases continue to increase on their current trajectories, it is projected that sea level may rise, at minimum, by a further 0.4 to 0.8 m (1.3 to 2.6 feet) by 2100, although future ice sheet melt could make these values considerably higher. Moreover, rising sea levels will not stop in 2100; sea levels will be much higher in the following centuries as the sea continues to take up heat and glaciers continue to retreat. It remains difficult to predict the details of how the Greenland and Antarctic Ice Sheets will respond to continued warming, but it is thought that Greenland and perhaps West Antarctica will continue to lose mass, whereas the colder parts of Antarctica could gain mass as they receive more snowfall from warmer air that contains more moisture. Sea level in the last interglacial (warm) period around 125,000 years ago peaked at probably 5 to 10 m above the present level. During this period, the polar regions were warmer than they are today. This suggests that, over millennia, long periods of increased warmth will lead to very significant loss of parts of the Greenland and Antarctic Ice Sheets and to consequent sea level rise.

Figure 6. Observations show that the global average sea level has risen by about 16 cm (6 inches) since the late 19th century. Sea level is rising faster in recent decades; measurements from tide gauges (blue) and satellites (red) indicate that the best estimate for the average sea level rise over the last decade is centred on 3.6 mm per year (0.14 inches per year). The shaded area represents the sea level uncertainty, which has decreased as the number of gauge sites used in calculating the global averages and the number of data points have increased. Source: Shum and Kuo (2011)
Page last updated: March 2020
Find out about the Royal Society's latest work on climate change and biodiversity
