Missing the wood for the trees: Carbon storage and other benefits of UK’s mature urban trees undervalued in canopy cover expansion plans
09 July 2021The amount of carbon stored in large, older trees may be underestimated by 50% or more, potentially leaving them undervalued in decisions around felling and tree canopy expansion, researchers taking part in the Royal Society’s Summer Science 2021, have said.
As part of the free online event, which runs from 8 to 11 July, scientists from the University of Edinburgh, Plymouth Marine Laboratory and University College London are exploring how satellites and other technologies are helping better account for our natural assets.
One area of growing interest is the impact of commitments to increase tree cover which have been adopted by a number of UK councils and in the Government’s England Trees Action Plan 2021-24.
Trees lock away carbon in their branches and trunk, and in urban areas provide a host of wider benefits to humans and other species.
But at the local level, healthy older trees are often removed, where they are classed as being damaging – or obstructive – on the basis that they will be replaced with equivalent tree cover.
This has previously sparked protests, in cities such as in Sheffield and Bristol, and Professor Mathias Disney, Professor of Remote Sensing at University College London says large old trees cannot be so easily replaced.
“Trees in our urban forests are undervalued,” said Professor Disney. “A lot of plans focus on tree cover, but this push could come at the expense of large, mature trees.”
“If one large tree is replaced with 10 small ones, the canopy cover may increase, but carbon storage will go down, as will most of these other benefits like shade tolerance or slowing surface water run-off – at least until the new trees survive beyond 20 or 30 years old, which is far from a given.”
UCL’s work has shown that conventional models of tree carbon storage, which estimate tree mass from the diameter of the trunk, are liable to significantly underestimate older trees where the “crown” of upper branches can make up the majority of their mass.
Now, using pulsed lasers (lidar) and drones, researchers can rapidly scan trees in 3D to ‘weigh’ them without cutting them down.
As part of their Summer Science work, Professor Disney’s group 3D-modelled one large plane tree outside the Royal Society’s building in London. They estimated the tree weighs around 23.3 tons – of which half the weight would be stored carbon – compared to 16.3 tons that would be estimated using conventional measures.
“On carbon alone this is a nearly 50% underestimate,” Professor Disney said. “Even more importantly, this large tree will absorb far more carbon each year than many small immature ones.
“So, we need to end the ‘chop first, ask questions later’ approach to older trees and make sure we are accurately accounting for these benefits when tree management plans are drawn up - especially as more areas look to expand their ambitions in this area.”

Image caption: 3D model of a London plane tree and the Duke of York statue. Credit: UCL (More information - https://skfb.ly/o6PMB)
These ground measurements are particularly important when they are used as the basis for estimating carbon storage across whole regions using satellite data – which is the focus of the Summer Science project, asking How can we track and trace carbon from space?
Using an interactive map, the project lets the public visualise changes in vegetation levels and forest fires, gasses in the atmosphere, like carbon dioxide and methane, or ocean phytoplankton location.
The team also map out some of the insights that have been gained from their research using satellite sensing across marine, atmospheric and terrestrial environments and how these could help mitigate and understand the impacts of climate change.
Our breathing oceans
Dr Gemma Kulk, a phytoplankton physiologist who is leading the Plymouth Marine Laboratory’s side of the project, is part of a team understanding the ocean’s “biological carbon pump” – where marine organisms absorb carbon dioxide as they grow, supporting life in the oceans and locking carbon away as they sink to the deep ocean.
Her research focuses on phytoplankton, photosynthetic marine microorganisms, which take up 50 gigatons of carbon a year – roughly the same as all vegetation on land.
Using a 21-year series of satellite ocean images, from 1998-2018, she has recently published a paper showing how this cycle is changing at a regional level – with phytoplankton becoming more productive in coastal and polar regions, but less productive in the open oceans.
Dr Kulk said, “I think what is special about using satellite observations is that it allows us to study the entire world’s oceans at high spatial resolution and over longer periods of time.”
Over recent years PML, UCL and the University of Edinburgh have been part of multi-institution collaborations with the likes of the European Space Agency, NASA and other organisations bringing together satellite data from different records and different sensors.
“This is especially important in producing a data record that is suitable for monitoring long-term climate change,” Dr Kulk added.
An eye on the atmosphere
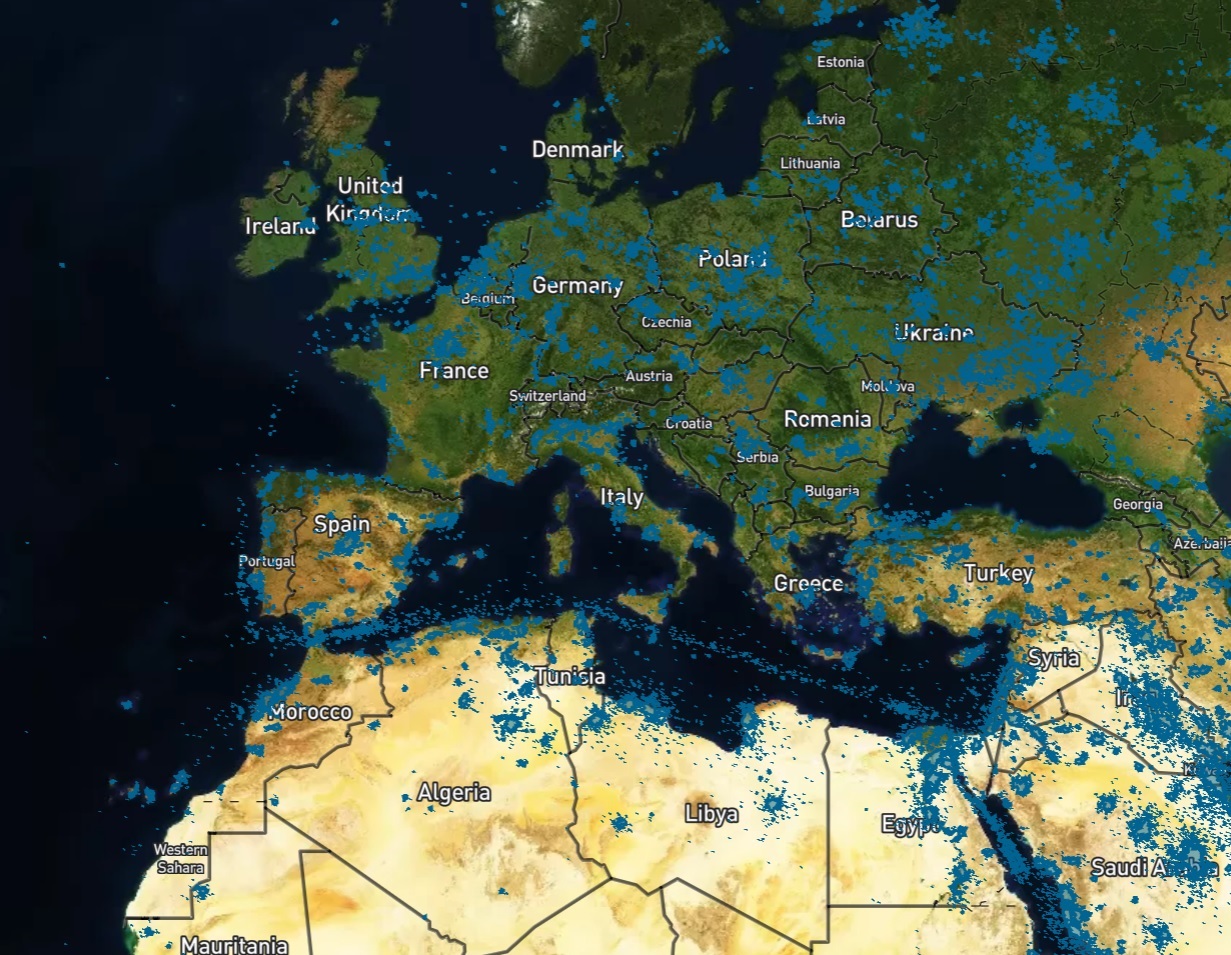
Image caption: NO2 plume map showing shipping lanes and urban centres across Europe and North Africa - http://www.ukatmosphere.org/dataplot/plume_map. Credit: Doug Finch
Professor Paul Palmer, Group Leader and Professor of Quantitative Earth Observation at the University of Edinburgh, is one of the groups using satellites to understand the movement of a whole range of important gases in the atmosphere.
This includes methane (CH4) – a potent greenhouse gas – and nitrogen dioxide (NO2) a harmful gas produced by cities, shipping lanes, power plants and other sources of incomplete combustion.
Ahead of Summer Science, Dr Doug Finch from Professor Palmer’s group has produced a map which shows human sources of NO2 around the world – http://www.ukatmosphere.org/dataplot/plume_map
Using machine learning to sift through large volumes of satellite data, the tool can identify plumes of NO2 that are difficult to observe using conventional methods. This approach could be used to monitor new power stations or sources of emissions in inaccessible areas.
“With satellite data we can see all over the world every few days, not just where we can routinely access from the ground, allowing us to build a much clearer picture,” Professor Palmer said.
“The UK punches well above its weight in this field. We’re involved at every stage, from developing and building satellite instruments to leading scientific studies that use data collected by the likes of the European Space Agency, NASA, or the Japanese Space Agency.
“That’s exemplified in our work and by the teams at UCL and the Plymouth Marine Laboratory.”