Demographic trends and policy options
John Bongaarts
Distinguished Scholar
Population Council
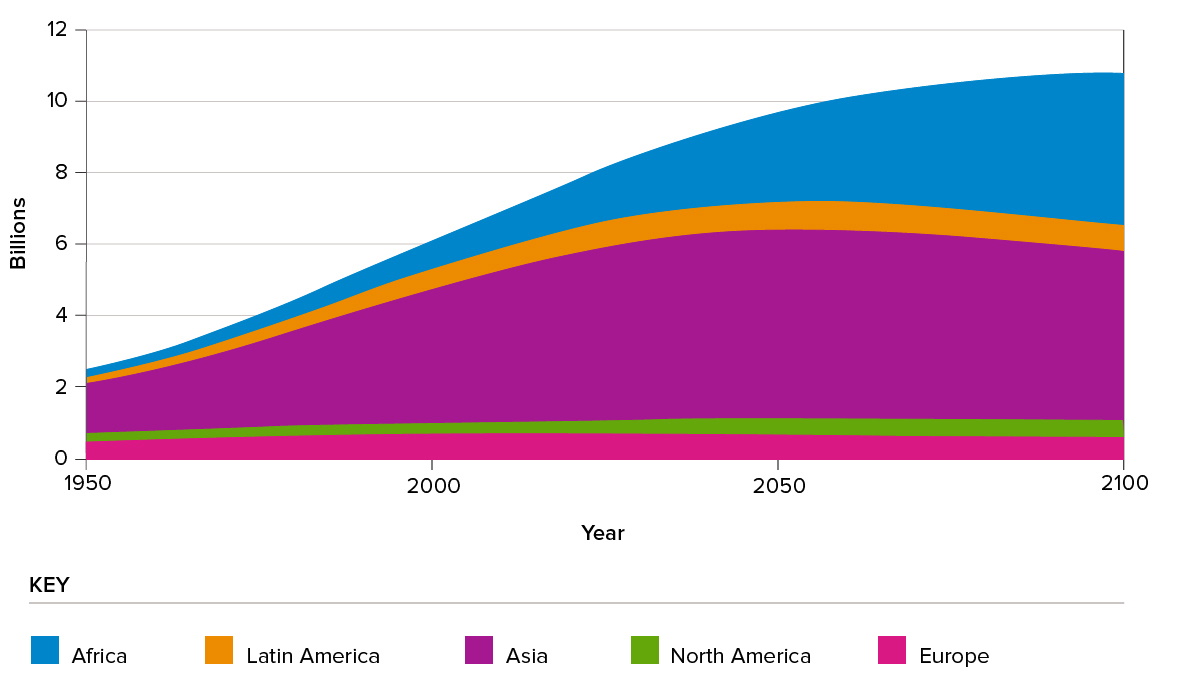
The world population grew at an historically unprecedented pace from 2.5 billion in 1950 to 7.8 billion in 2020. This tripling of population size has had wide-ranging adverse consequences for human welfare and the natural environment. The expansion is expected to continue in future decades reaching 10.9 billion in 21001. In theory, the human impact on nature can be offset by reducing per capita consumption of natural resources especially in the rich world and by developing green technology. But in practice there is no doubt that this projected growth will do substantial further harm.
This essay consists of three parts. First, demographic trends and projections for the world and its main regions will be summarized. The second part discusses options available to governments in the less developed countries (LDCs) to slow rapid population growth by investing in reproductive health programmes to assist women in avoiding unplanned pregnancies. I conclude with a brief assessment of the impact of fertility decline on population trends.
1. Demographic trends
Population size
The “demographic transition” refers to a process of long-range demographic change observed historically in populations around the world. A transition usually takes a century or more to unfold and is accompanied by the transformation of traditional agricultural societies into modern industrial ones. During the transition, initially high mortality and high fertility decline to low levels (mortality first, fertility after a delay) with a period of rapid population growth in the middle. Over the course of the transition, population size multiplies many times.
Today, Africa’s rapidly growing population is in mid-transition. South and West Asia and Latin America are nearing the end of their transitions and the more developed countries (MDCs) and East Asia have reached the end with near zero or even negative growth rates. These regional growth differences are expected to persist in future decades (Figure 1) with the addition of 3 billion between 2020 and 2100, mostly in Africa and South and West Asia. Populations of East Asia and Europe are expected to decline modestly.
Figure 1: World population estimates and projections by region
Fertility
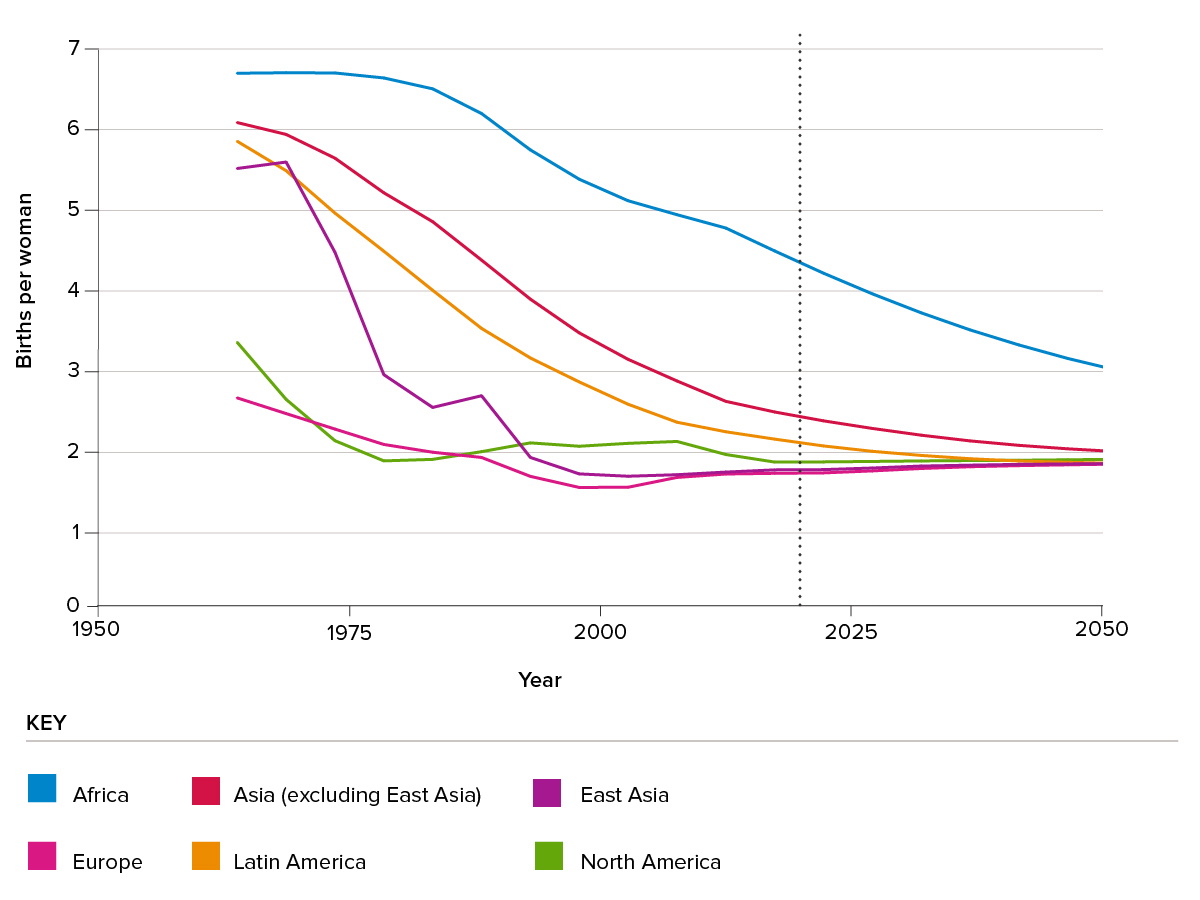
Before the demographic transition, contraceptive use was rare, and women typically had around six or seven births. Declines in fertility first began in the MDCs in the 19th century as these societies experienced rapid socio-economic changes. The cost of children (e.g. for education) rose and their economic value (e.g. for labor and old age security) declined leading couples to limit family size. The fertility transition in the MDCs was complete by the 1970s. The fertility transitions in Asia and Latin America started in the late 1960s and are now nearly complete. In contrast, sub-Saharan Africa has experienced only limited reproductive change by 2020 (Figure 2). High fertility remains the main driver of future population growth in Africa.
UN projections for coming decades assume that fertility will eventually stabilize around or slightly below 2 births per woman everywhere.
Figure 2: Fertility estimates 1960-2020 and projections to 2050
Mortality
Before the 18th century, epidemics, famines and wars were frequent, and life expectancy was only about 30 years. One of the most notable achievements of modern societies is the large rise in human longevity over the past two centuries. The mortality transition started in Northern Europe around 1800 as public health measures reduced water- and food-borne diseases, better nutrition improved resistance to disease, and inoculation and vaccination prevented certain infectious diseases. Mortality decline in MDCs accelerated after 1900 with the wide acceptance of the germ theory of disease and the development of antibiotics, resulting in today’s life expectancy of 80 years.
The LDCs experienced only modest mortality declines before 1950 when life expectancy was still only 38 years in Africa, 42 years in Asia and 51 years in Latin America. Since 1950 change has been rapid due to access to medical care, public health measures and the availability of antibiotics and other drugs. Today, life expectancies in Latin America (75) and Asia (72) are similar to those of Europe in the 1970s. Africa still lags even though life expectancy has risen to 60 years. Projections of life expectancy to 2100 assume continued improvements in all regions, with the MDCs reaching near 90 years and the LDCs 81 years.
Urbanization
The current era of rapid urbanization began with the onset of the Industrial Revolution as surplus labor from rural areas moved to cities in search of a better life. Urbanization was more rapid in MDCs than in LDCs with the 1950 proportion living in urban areas reaching 55% and 18%, respectively2. Over the past half century urbanization has proceeded everywhere with the world average doubling from 30% in 1950 to 56 % in 2020. UN projections expect the urban proportion to reach 87% in MDCs and 66% in LDCs by 20503.
In recent decades, overall population growth and rising urbanization produced extremely rapid growth in the urban populations of LDCs. This expansion has been difficult to absorb in the poorest countries where urban infrastructure has not kept pace, resulting in lack of public transportation, housing, clean water and sanitation, and overcrowded schools and health facilities. The scarcity of housing has led to the explosive growth of slum areas where the poor and marginalized live with limited access to infrastructure and services. A large proportion of the billions of people expected to be added to the LDCs in the future will end up living in very poor conditions.
Ageing
Over the course of the demographic transition, populations age as the proportion of young people declines and the proportion of old people rises – the result of declining fertility and rising lifespans. Today the proportion over 65 ranges from a low of 3% in sub-Saharan Africa to a high of 18% in Europe and Northern America4.
The ageing process starts in the middle of the demographic transition with the decline in the birth rate. This decline initially has a beneficial economic effect as the reduction in the young population temporarily raises the proportion of the population in the labor force, thus giving the economy a boost (aka the “demographic dividend”). However, late in the transition the proportion above age 65 rises rapidly, thus putting pressure on pension and healthcare systems, and slowing economic growth. This is now the situation in most MDCs. By 2100 populations everywhere will age further with proportions over 65 ranging up to a third of the total population.
International Migration
The stock of international migrants reached 272 million in 2019 (3.5% of the global population), an increase of 51 million since 20105. Europe hosted the largest number of international migrants (82 million), followed by Northern America (59 million) and Northern Africa and Western Asia (49 million). The other regions have been net senders of migrants during 2010-2020.
Forced displacements across international borders are still rising. The global number of refugees and asylum seekers increased by about 13 million between 2010 and 2017, accounting for close to a quarter of the increase in the number of all international migrants. Northern Africa and Western Asia hosted around 46 percent of the global number of refugees and asylum seekers, followed by sub-Saharan Africa (close to 21 per cent).
2. Policy options in high fertility countries
Governments in LDCs that wish to reduce the harmful effects of rapid population growth and high unplanned fertility have focused on two general options: stimulate socio-economic change to reduce fertility and invest in family planning programmes to assist women in achieving their reproductive objectives.
1) Accelerate socio-economic development
As countries develop, fertility declines. In general, the higher a country’s GDP per capita, or level of education or urbanization, the lower its fertility. But for many decades there was no agreement on the dominant driver of fertility decline. However, the extensive literature on this topic increasingly emphasized the central role of education and especially women’s education6, 7, 8, 9, 10, 11, 12 and 13. For example, according to one commentary14, “...educational attainment is not just one of many socio-economic factors that matter …[it] is the single most important source of empirically observable population heterogeneity.” In multivariate regressions education consistently has a strong and statistically significant effect on fertility in LDCs, while other variables such as GDP per capita and urbanization do not15.
The effect of women’s education on fertility is attributed to greater autonomy in decision-making, more knowledge about reproduction and contraception, higher potential for earnings, and rising opportunity costs of childbearing16, 17 and 18. Mass schooling also lowers fertility by reducing the child’s potential to work in or outside the home, raising the costs of children, and speeding up cultural change19.
While there is a growing consensus about the key role of education as a driver of fertility decline, there is less agreement about the effect of child mortality. Empirical evidence suggests that mortality decline is a necessary but not sufficient condition for fertility decline and that additional social and economic changes are needed to bring about reproductive change. For example, in some contemporary Western African countries (e.g. Chad, DRC, Niger, and Mali), child mortality has been cut in half since the 1950s, but fertility has changed little20.
2) Family planning programmes
The rapid growth of LDC populations after 1950 led national and international policymakers to become concerned about the threat of this growth to improvements in the well-being of the people in these poor societies. Many LDC governments—with substantial international assistance—implemented voluntary family planning programmes to provide access to and information about contraceptives21, 22 and 23. These programmes assisted women and men to control their reproductive lives and to avoid unwanted childbearing, thus reducing fertility and population growth.
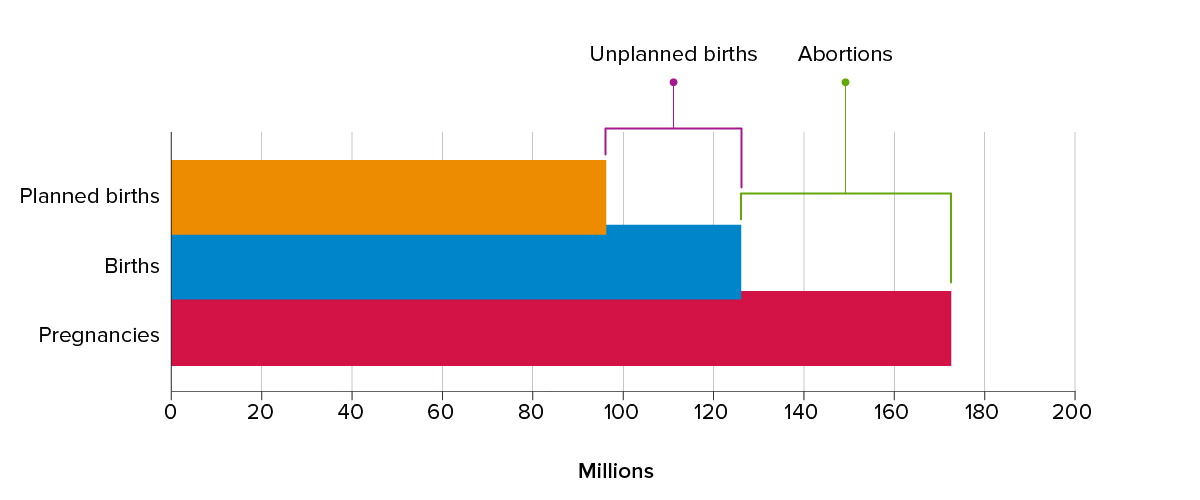
The choice of family planning (FP) programmes as the main policy approach to meet people’s reproductive needs, is based largely on the documentation of an unsatisfied demand for contraception, which is often referred to as an “unmet need” for contraception24 and 25. Unmet need refers to the status of women who are at risk of pregnancy and do not want to get pregnant but are not currently using contraception. Worldwide, approximately 227 million women have an unmet need for modern contraception26. The causes of unmet need include the cost of contraception; fear of side effects, opposition from spouses and other family members, and from religious or political leaders27 and 28. This unmet need inevitably leads to unplanned pregnancies. In low- and middle-income countries, about 76 million unplanned pregnancies occur each year, accounting for 38 percent of all pregnancies across these countries. (These estimates ignore a small number of miscarriages and stillbirths). These unplanned pregnancies end in 47 million induced abortions and 29 million unplanned births per year29 (see Figure 3).
Figure 3: Annual number reproductive events, LMIs, 2017
Past evaluations of FP programmes have found their impact on contraceptive use and fertility to be substantial. Three different approaches have been used to obtain impact estimates:
a. Controlled experiments
This is the gold standard for evaluating interventions, but very few large-scale controlled experiments have been conducted to assess family planning programmes because they are expensive and take a long time to complete. The largest and most influential of these experiments started in the late 1970s in Matlab, a rural district in Bangladesh30 and 31. The experiment divided the rural Matlab district into experimental and control areas of approximately equal size. The control area received no new services, while in the experimental area, comprehensive high-quality family planning services were provided.
The impact of the new services was large and immediate. Within two years, contraceptive use jumped from 5 to 33% among women in the experimental area while little change occurred in the control area. As a result, fertility declined more rapidly in the experimental than in the control area and a difference of around 1.5 births per woman between the areas was maintained through the 1980s. The Matlab experiment demonstrated that voluntary family-planning programmes can succeed even in poor, highly traditional societies.
b. Natural experiments
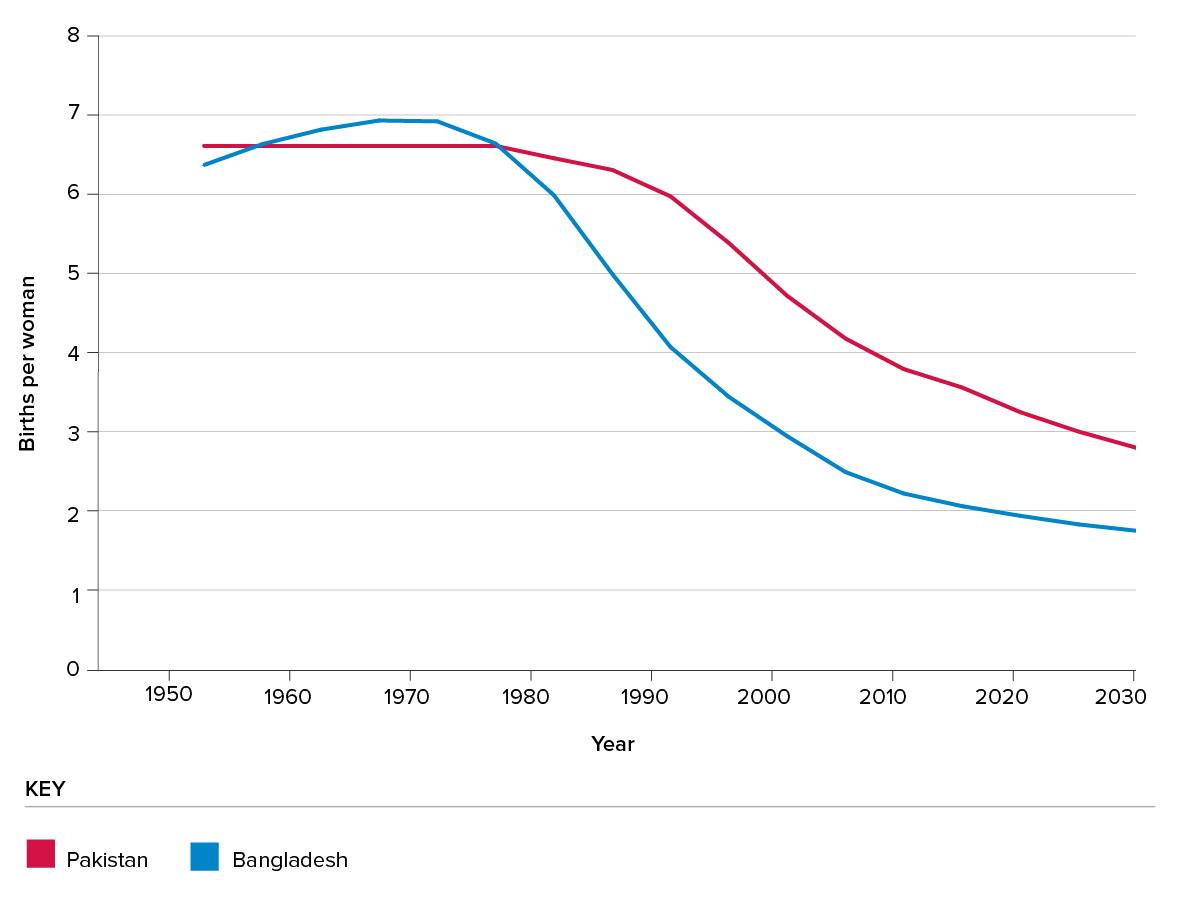
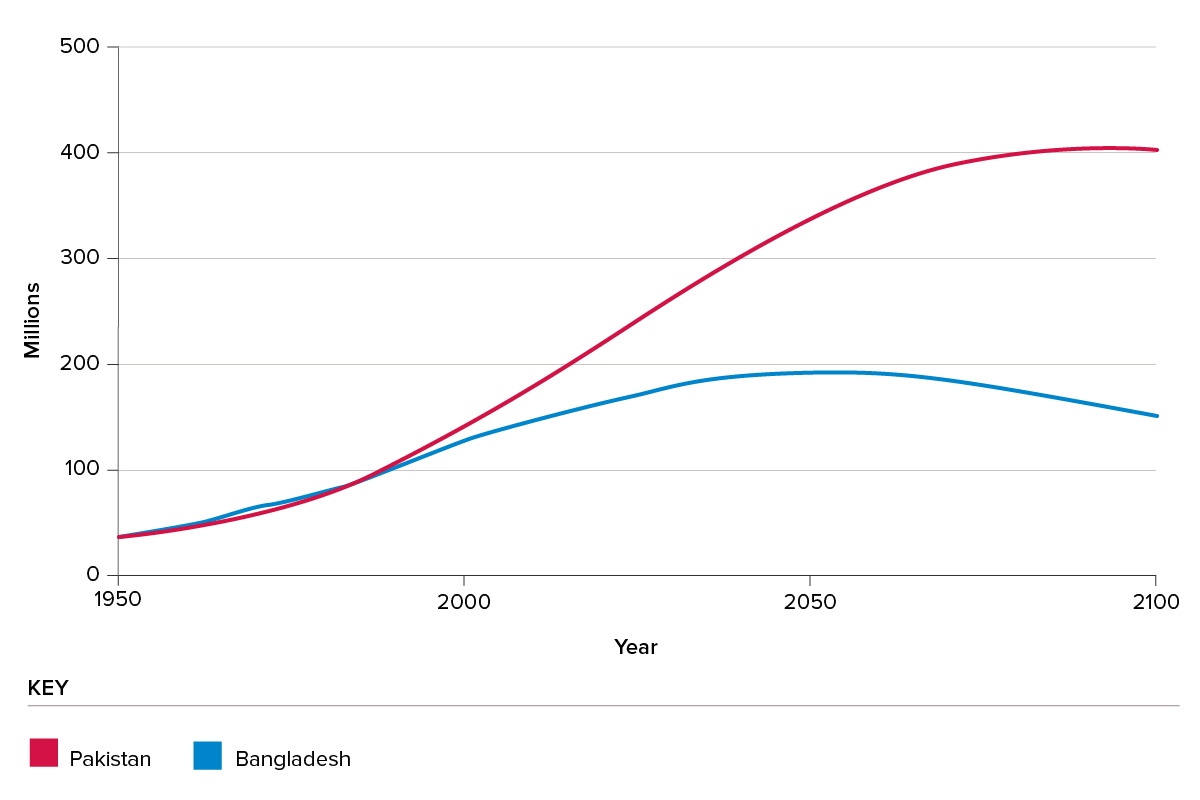
Natural experiments compare two countries with similar social, economic, cultural, and religious characteristics, but with differing approaches to family planning programmes32, 33 and 34. An instructive example is a comparison of Bangladesh and Pakistan. These two populations had similar levels of development in the 1970s when the government of Bangladesh implemented a high-quality voluntary family planning programme while Pakistan’s programme remained weak35. This programme difference is likely the main cause of the difference in subsequent fertility trajectories of Bangladesh and Pakistan (Figure 4). In 1975–80 the two countries had nearly the same high fertility of 6.8 births per woman, but by 2010–15 Bangladesh’s fertility declined to 2.2 births per woman, while in Pakistan, fertility still stood at 3.8, a difference of 1.6 births per woman36. Similar results hold for other country pairs with comparable levels of development but differences in programmes37, 38 and 39.
Figure 4: Fertility 1950-2020
c. Regression analyses
Country-level regression analysis can also be used to estimate the fertility effects of programmes. In these regressions, fertility is the dependent variables and a set of socio-economic indicators and a programme score index are the independent variables40, 41 and 42. For example, a recent commentator43 estimates that the best programmes in sub-Saharan Africa reduced fertility by about 1.5 births per woman. This estimate is similar to the effects found in the Matlab experiment and the natural experiments.
3. Impact on population trends
Any program-induced fertility decline will (other things being equal) change the future trajectory of population growth. To illustrate, we compare Pakistan and Bangladesh where the program induced differences in fertility trajectories resulted in increasingly large differences in population size over time (see figure 5). In 1980 the two populations were virtually the same size (ca. 80 million). However, by 2100, Pakistan’s population is projected to be more than double the size of Bangladesh’s (403 vs 151 million)44. This suggests that the Bangladesh family planning program led to a large cut in the country’s potential 2100 population. Fertility and population trends are also affected by levels of socioeconomic development. But this is unlikely to be the dominant explanation for the different population trajectories, since development levels as measured by the Human Development Index have been nearly the same for Bangladesh and Pakistan, which are both poor agricultural majority-Muslim countries in South Asia45.
Figure 5: Population estimates and projections
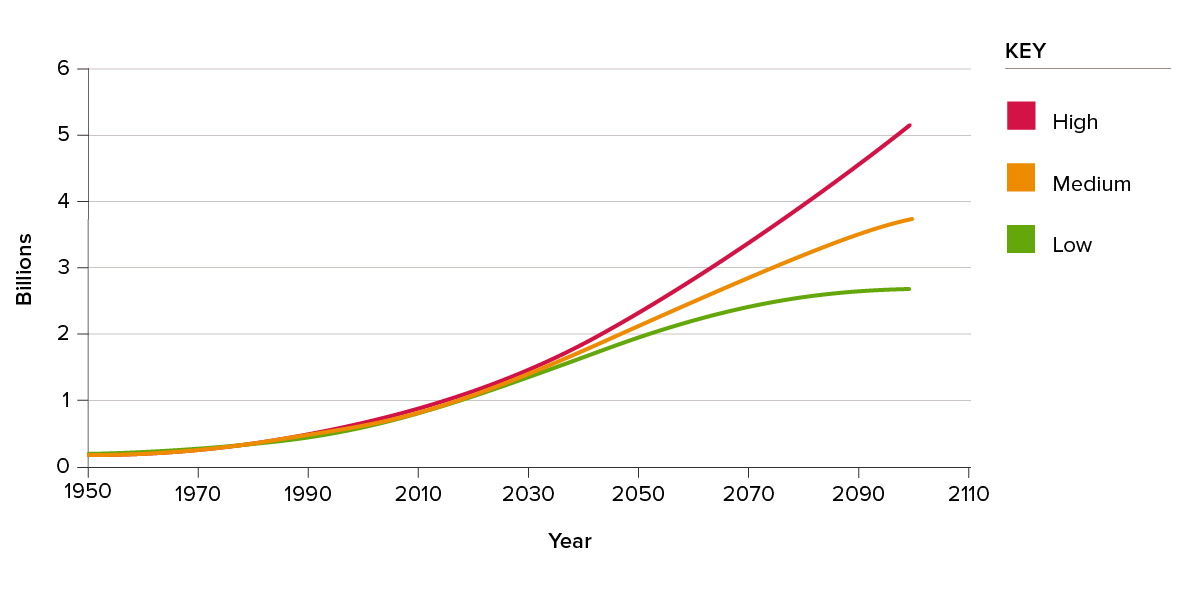
To assess the potential demographic impact of a substantial investment in family planning programs in sub-Saharan Africa, I compare the high and low variants of the UN population projections for sub-Saharan Africa as shown in Figure 646. The only difference between these two projection variants is the fertility level assumed in the future: the high variant exceeds the low variant by 1 birth per woman. This one-birth difference is at the low end of the decline that good family planning programs can bring about and the comparison of the high and low variants therefore gives a conservative estimate of program impact on population trends.
According to the medium variant, the population of sub-Saharan Africa will nearly quadruple in size from 1 billion in 2018 to 3.8 billion in 2100 (see Figure 6). This projection assumes a steady decline in fertility and includes the impact of the AIDS epidemic. The high variant (with fertility a half birth higher than in the medium variant) ends up at 5.2 billion people in 2100. This trajectory could well become reality if no significant further investments are made in family planning, because past fertility declines have been much slower in sub-Saharan Africa than in Asia and Latin America. The UN’s low variant projection (with fertility a half birth below the medium variant) estimates a population of 2.7 billion in 2100. With substantial new investments in family planning, the low variant could well be achieved. In that case, the population of sub-Saharan Africa in 2100 would be nearly 2.5 billion lower than projected in the UN’s high variant and 1.3 billion below the medium variant. Clearly, small changes in fertility have large effects on population trajectories in the long run.
Figure 6: Population projections, sub-Saharan Africa
Conclusion
Population growth is one of the factors causing a decline in biodiversity. This fact is often ignored by policy makers in part because the matter is sensitive and there is opposition to family planning programmes from conservative groups, from those who fear coercion and from analysts who believe that nothing can be done. The evidence is now clear that voluntary family planning programmes are needed to help women achieve their reproductive goals and reduce unplanned fertility in particular in the poorest societies. These programmes improve lives of women, their children, and their communities, enhance prospects for poverty reduction and moderate the increasingly harmful impact of human activities on the natural environment.