10. Does the recent slowdown of warming mean that climate change is no longer happening?
No. After the very warm year 1998 that followed the strong 1997-98 El Niño, the increase in average surface temperature slowed relative to the previous decade of rapid temperature increases. Despite the slower rate of warming, the 2000s were warmer than the 1990s. The limited period of slower warming ended with a dramatic jump to warmer temperatures between 2014 and 2015, with all the years from 2015-2019 warmer than any preceding year in the instrumental record. A short-term slowdown in the warming of Earth’s surface does not invalidate our understanding of long-term changes in global temperature arising from human-induced changes in greenhouse gases.
Decades of slow warming as well as decades of accelerated warming occur naturally in the climate system. Decades that are cold or warm compared to the long-term trend are seen in the observations of the past 150 years and are also captured by climate models. Because the atmosphere stores very little heat, surface temperatures can be rapidly affected by heat uptake elsewhere in the climate system and by changes in external influences on climate (such as particles formed from material lofted high into the atmosphere from volcanic eruptions).
More than 90% of the heat added to the Earth system in recent decades has been absorbed by the oceans and penetrates only slowly into deep water. A faster rate of heat penetration into the deeper ocean will slow the warming seen at the surface and in the atmosphere, but by itself it will not change the long-term warming that will occur from a given amount of CO2. For example, recent studies show that some heat comes out of the ocean into the atmosphere during warm El Niño events, and more heat penetrates to ocean depths in cold La Niñas. Such changes occur repeatedly over timescales of decades and longer. An example is the major El Niño event in 1997–98 when the globally averaged air temperature soared to the highest level in the 20th century as the ocean lost heat to the atmosphere, mainly by evaporation.
Even during the slowdown in the rise of average surface temperature, a longer-term warming trend was still evident (see Figure 4). Over that period, for example, record heatwaves were documented in Europe (summer 2003), in Russia (summer 2010), in the USA (July 2012), and in Australia (January 2013). Each of the last four decades was warmer than any previous decade since widespread thermometer measurements were introduced in the 1850s. The continuing effects of the warming climate are seen in the increasing trends in ocean heat content and sea level, as well as in the continued melting of Arctic sea ice, glaciers and the Greenland ice sheet.
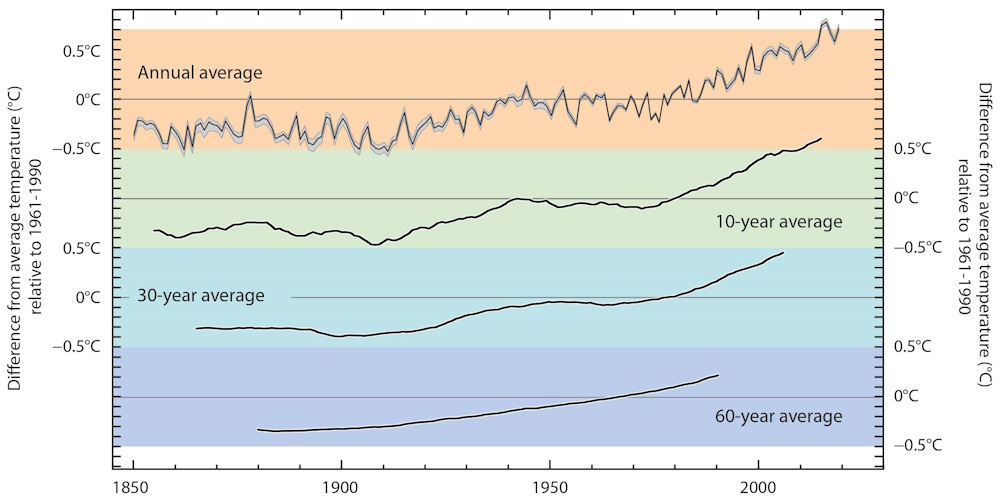
Figure 4. The climate system varies naturally from year to year and from decade to decade. To make reliable inferences about human-induced climate change, multi-decadal and longer records are typically used. Calculating a “running average” over these longer timescales allows one to more easily see long-term trends. For the global average temperature for the period 1850-2019 (using the data from the UK Met Office Hadley Centre relative to the 1961-90 average) the plots show (top) the average and range of uncertainty for annually averaged data; (2nd plot) the annual average temperature for the ten years centred on any given date; (3rd plot) the equivalent picture for 30-year; and (4th plot) the 60-year averages. Source: Met Office Hadley Centre, based on the HadCRUT4 dataset from the Met Office and Climatic Research Unit (Morice et al., 2012).
Page last updated: March 2020
Find out about the Royal Society's latest work on climate change and biodiversity