9. Does the rate of warming vary from one decade to another?
Yes. The observed warming rate has varied from year to year, decade to decade, and place to place, as is expected from our understanding of the climate system. These shorter-term variations are mostly due to natural causes, and do not contradict our fundamental understanding that the long-term warming trend is primarily due to human-induced changes in the atmospheric levels of CO2 and other greenhouse gases.
Even as CO2 is rising steadily in the atmosphere, leading to gradual warming of Earth’s surface, many natural factors are modulating this long-term warming. Large volcanic eruptions increase the number of small particles in the stratosphere that reflect sunlight, leading to short-term surface cooling lasting typically two to three years, followed by a slow recovery. Ocean circulation and mixing vary naturally on many time scales, causing variations in sea surface temperatures as well as changes in the rate at which heat is transported to greater depths. For example, the tropical Pacific swings between warm El Niño and cooler La Niña events on timescales of two to seven years. Scientists know of and study many different types of climate variations, such as those on decadal and multi-decadal timescales in the Pacific and North Atlantic Oceans, each with its own unique characteristics. These oceanic variations are associated with significant regional and global shifts in temperature and rainfall patterns that are evident in the observations.
Warming from decade to decade can also be affected by human factors such as variations in the emissions, from coal-fired power plants and other pollution sources, of greenhouse gases and of aerosols (airborne particles that can have both warming and cooling effects).
These variations in the temperature trend are clearly evident in the observed temperature record (see Figure 4). Short-term natural climate variations could also affect the long-term human-induced climate change signal and vice-versa, because climate variations on different space and timescales can interact with one another. It is partly for this reason that climate change projections are made using climate models (see infobox, p.20) that can account for many different types of climate variations and their interactions. Reliable inferences about human-induced climate change must be made with a longer view, using records that cover many decades.
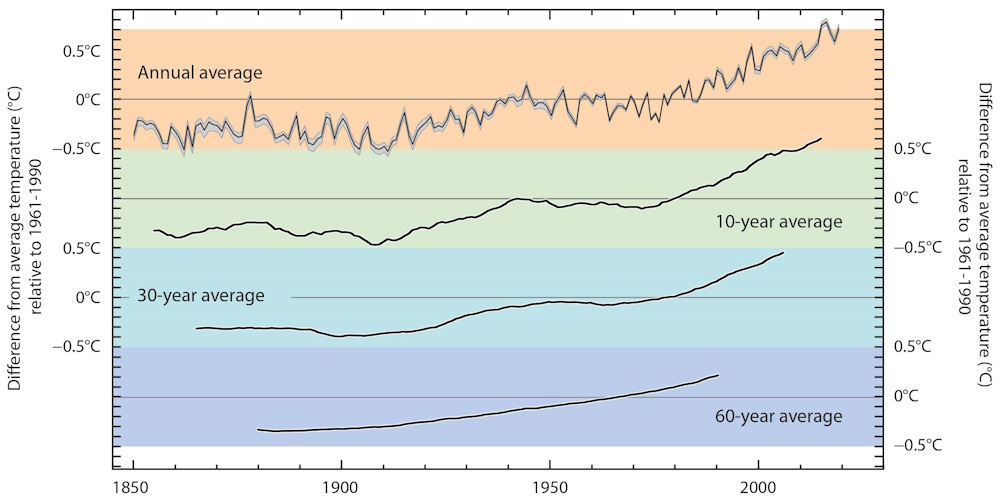
Figure 4. The climate system varies naturally from year to year and from decade to decade. To make reliable inferences about human-induced climate change, multi-decadal and longer records are typically used. Calculating a “running average” over these longer timescales allows one to more easily see long-term trends. For the global average temperature for the period 1850-2019 (using the data from the UK Met Office Hadley Centre relative to the 1961-90 average) the plots show (top) the average and range of uncertainty for annually averaged data; (2nd plot) the annual average temperature for the ten years centred on any given date; (3rd plot) the equivalent picture for 30-year; and (4th plot) the 60-year averages. Source: Met Office Hadley Centre, based on the HadCRUT4 dataset from the Met Office and Climatic Research Unit (Morice et al., 2012).
Page last updated: March 2020
Find out about the Royal Society's latest work on climate change and biodiversity